U.S. NATURAL GAS:
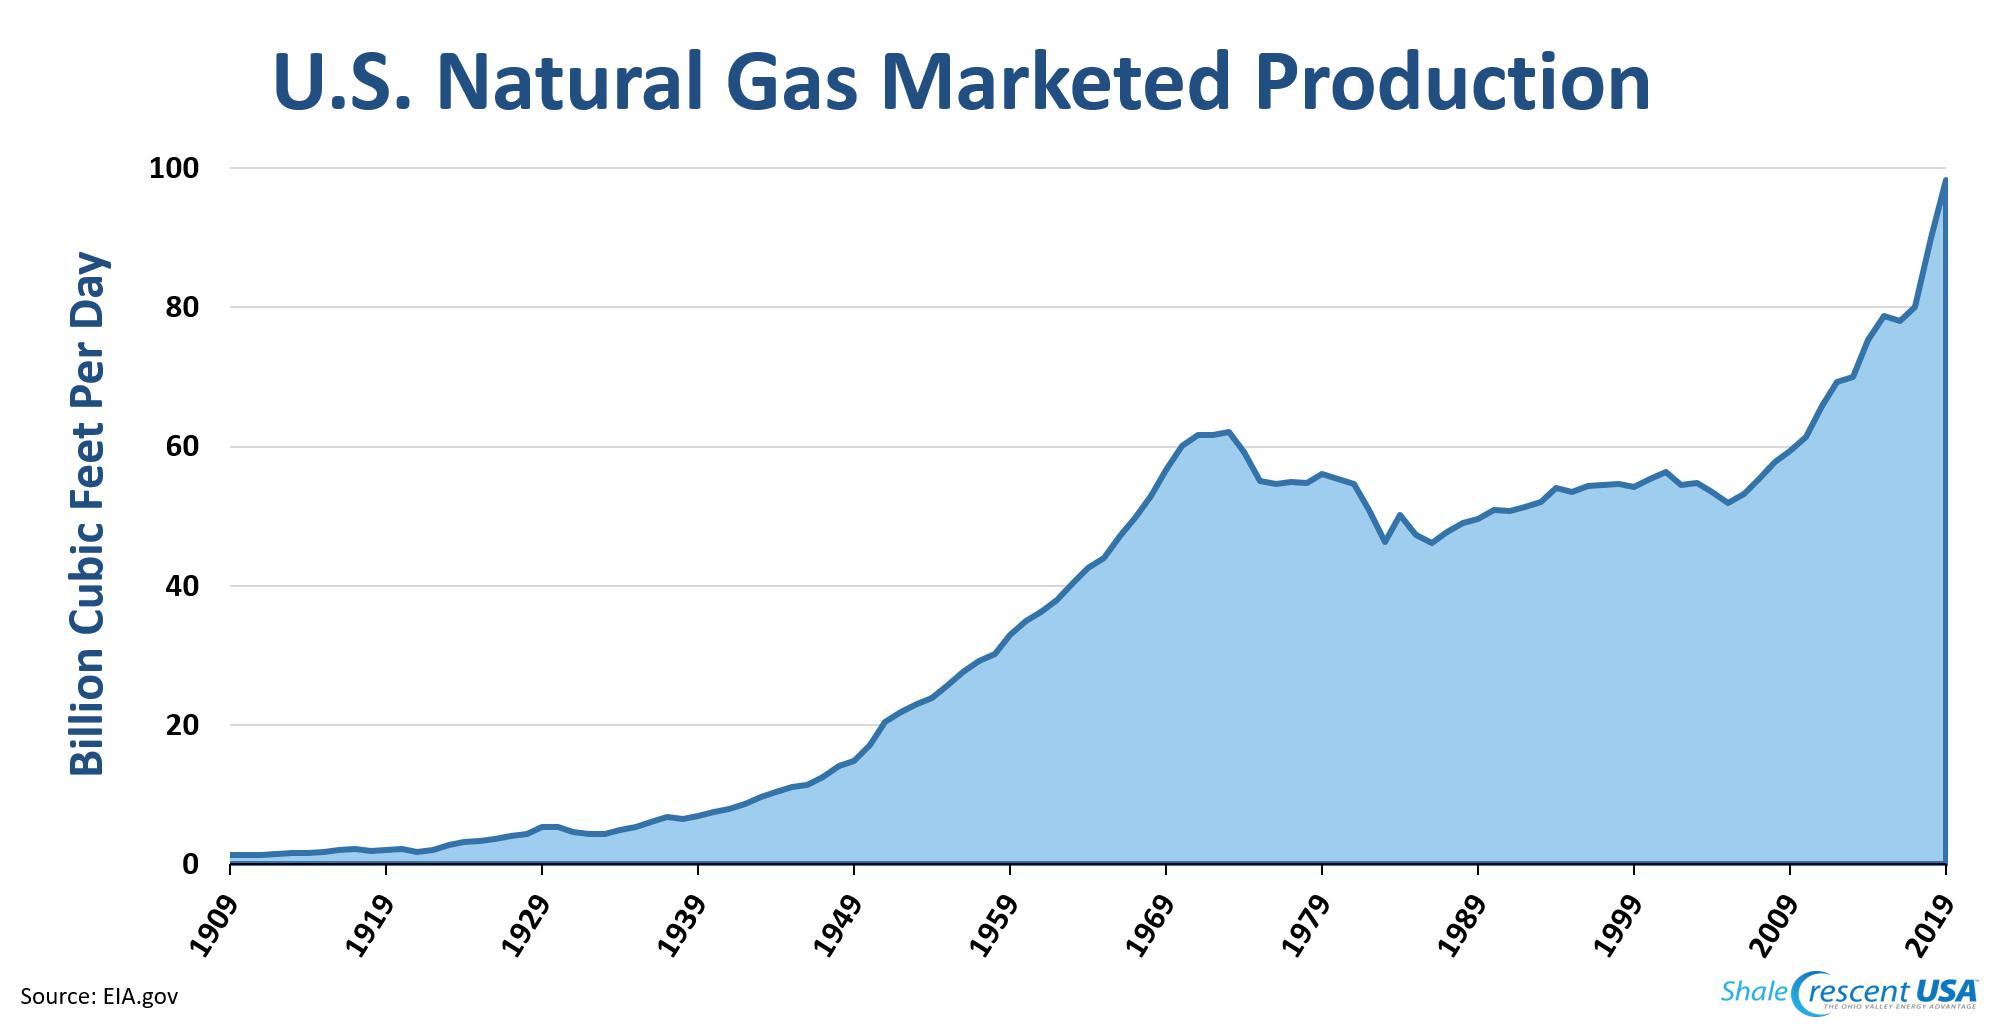
Over the past 10 years, United States natural gas production has risen to record levels due to horizontal drilling. The U.S. has become the number one natural gas producing country in the world and now exceeds its previous peak of natural gas production set in the early 1970’s by 50%. In addition, the U.S. has transitioned from a net importer of natural gas to a net exporter of natural gas. In 2008, the U.S. was producing an average of 58 billion cubic feet per day (bcf/d) of marketed natural gas. In 2019, U.S. marketed natural gas production had risen to just under 100 bcf/d. Furthermore, U.S. natural gas production is projected to continue to increase.
SHALE CRESCENT USA NATURAL GAS:
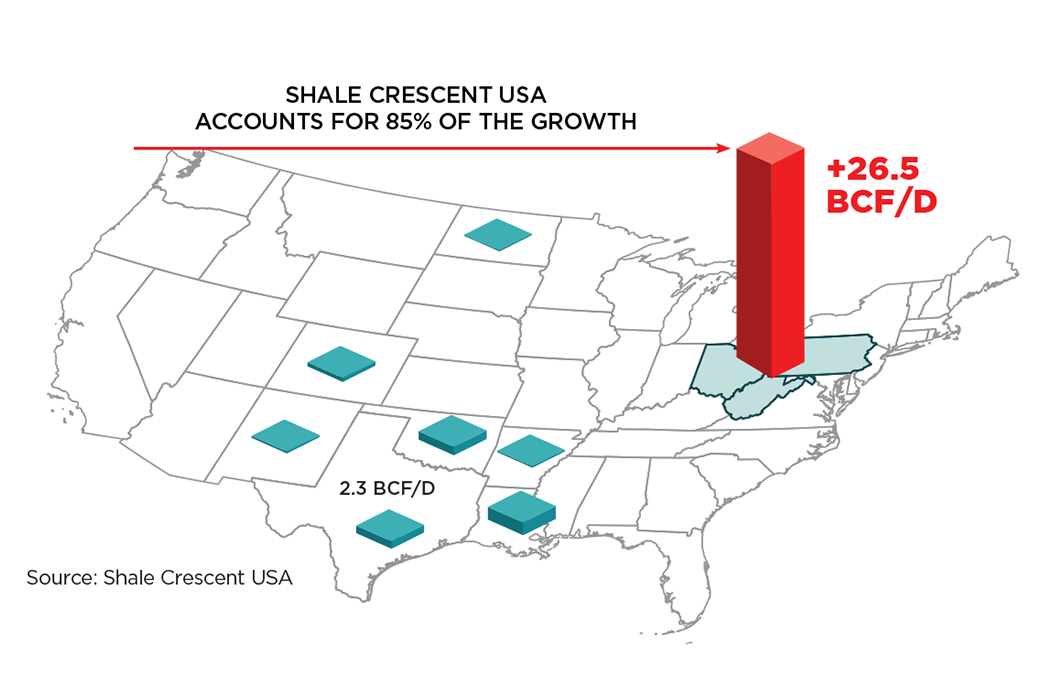
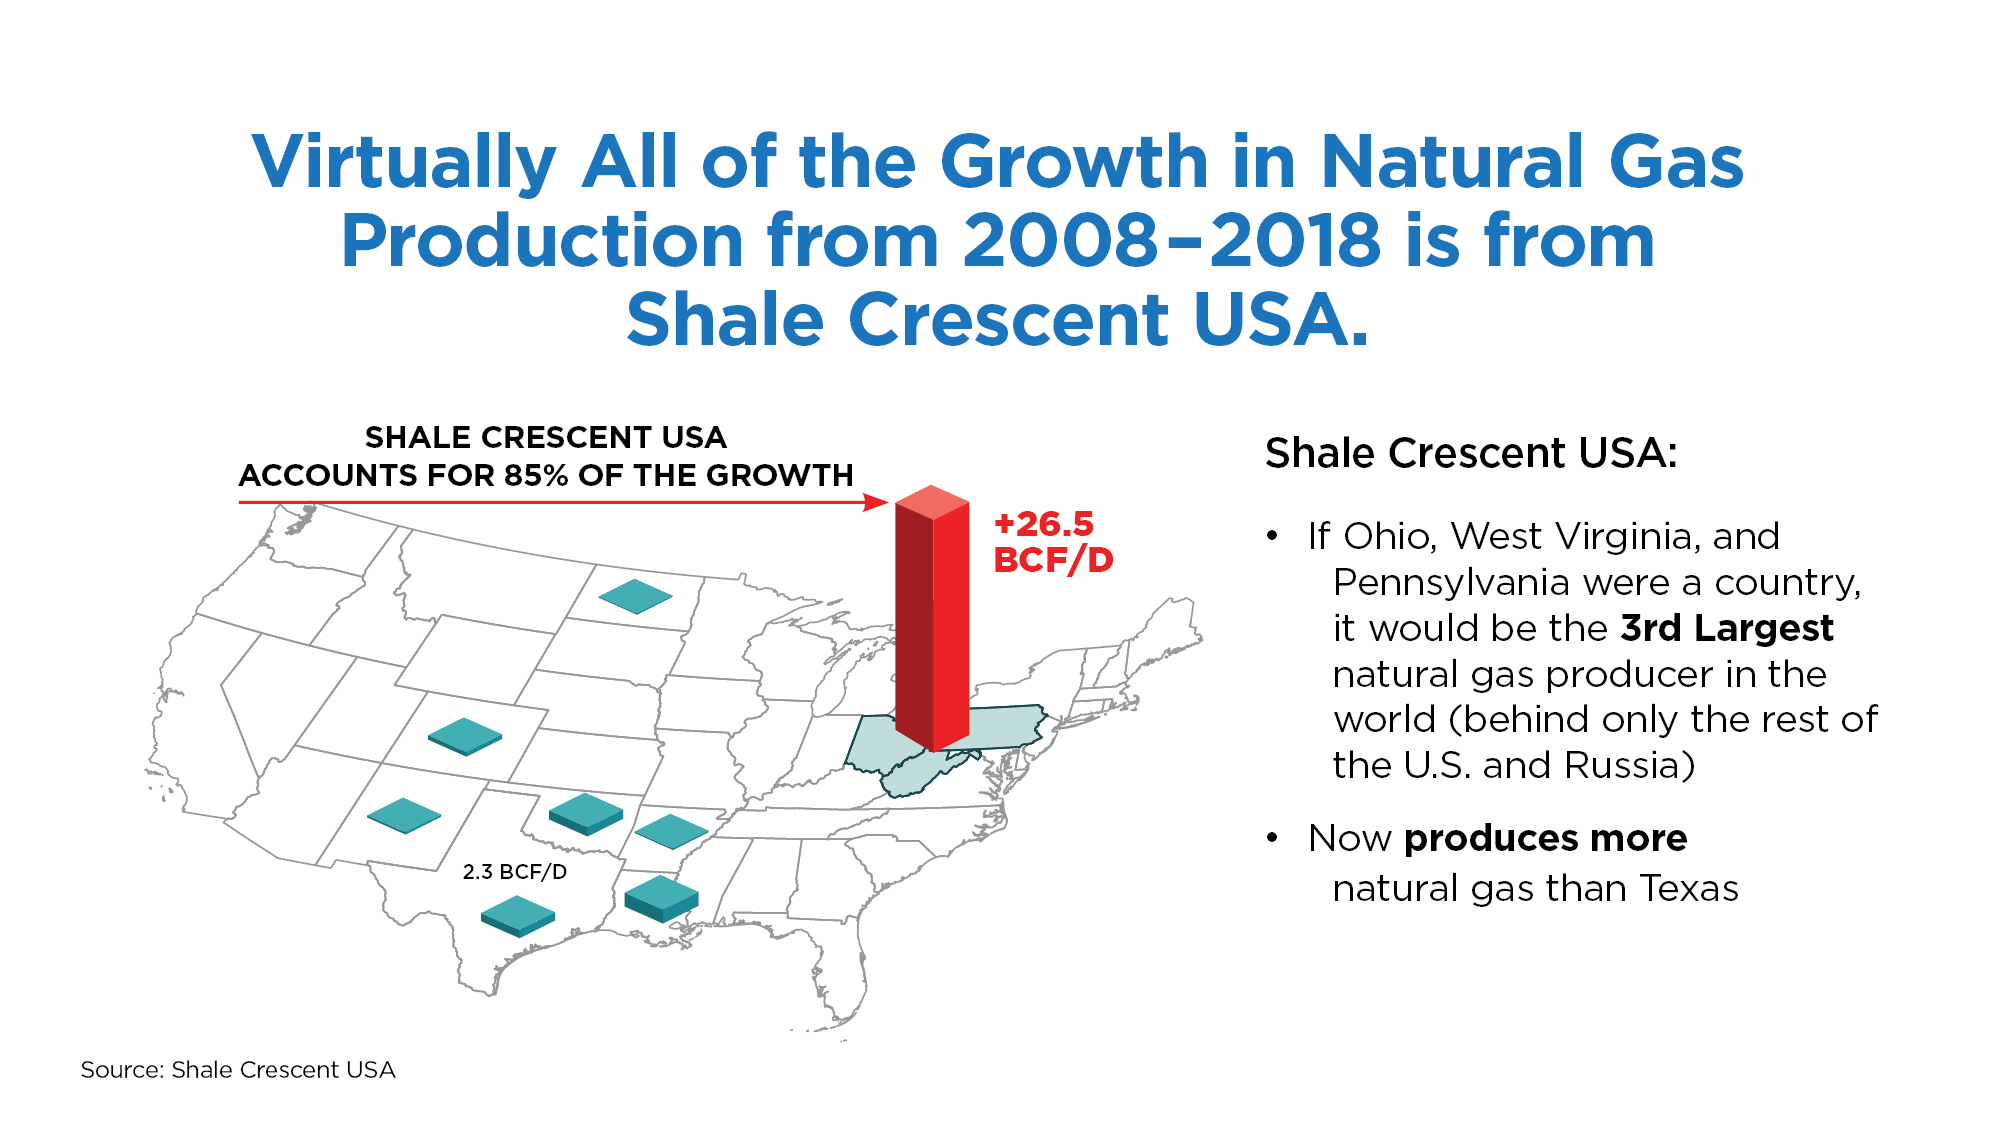
For decades, the Gulf Coast has been the major oil and gas producing region in the U.S. and therefore the low cost supplier of natural gas and ethane. However, nearly all the growth of natural gas production since 2008 has come from the Shale Crescent USA region.
Today, Shale Crescent USA (comprised of Ohio, West Virginia, and Pennsylvania) is the major producing region in the U.S. and is now the low cost supplier of natural gas and ethane. This surprising and unprecedented shift in natural gas production began in 2008 in the Shale Crescent USA which sits atop the Marcellus and Utica Shale formations. In fact, 85% of the new U.S. natural gas supply has come from Shale Crescent USA.
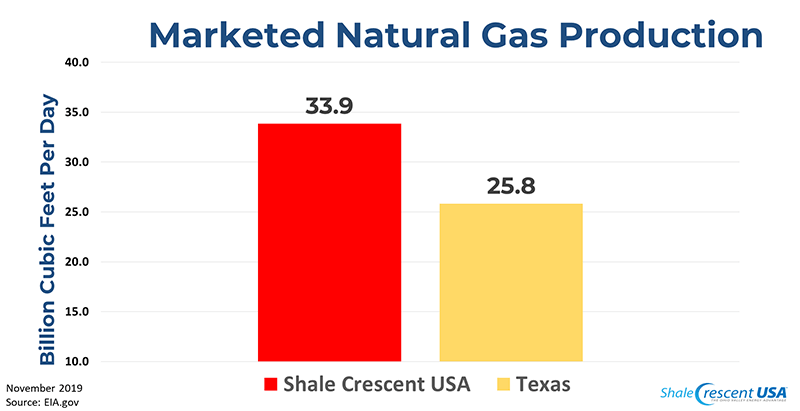
According to U.S. Energy Information Administration (EIA) data, in November of 2019, Shale Crescent USA’s average daily production of natural gas was 33.9 Billion Cubic Feet per day (BCF/D). To put that in perspective, Shale Crescent USA (Ohio, West Virginia and Pennsylvania) which is half the land mass of Texas now out produces the state of Texas.
In 2010 Shale Crescent USA produced 3% of the nation’s natural gas. By November of 2019, Shale Crescent USA accounted for over 33% of total U.S. natural gas production and is projected to account for more than 45% of the nation’s production by 2040. Stated differently, Shale Crescent USA is projected by 2040 to produce almost as much natural gas as the entire United States produced before the shale revolution.

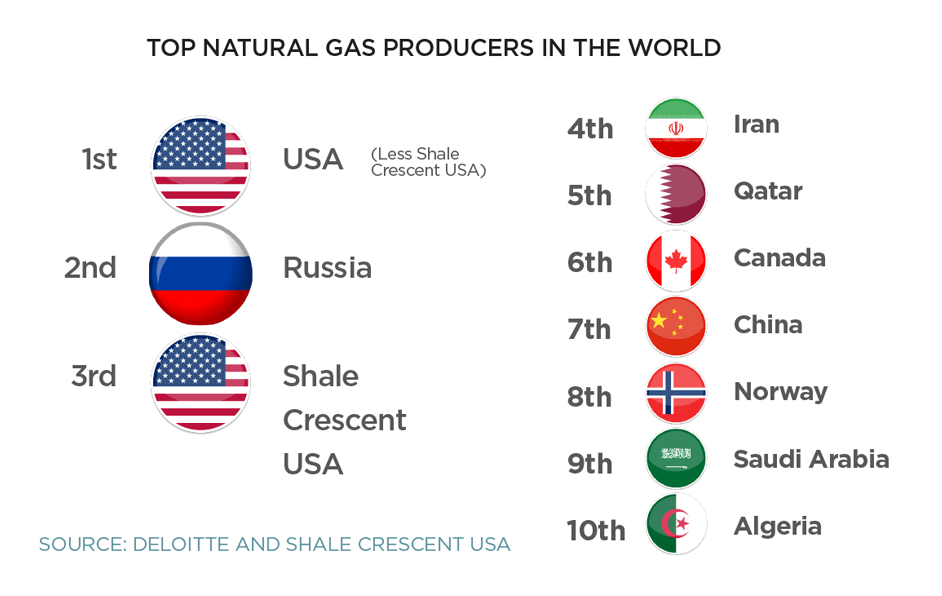
If Ohio, West Virginia and Pennsylvania were a country, it would be the third largest natural gas producing country in the world. This means Shale Crescent USA alone produces more natural gas than Iran, Qatar, Canada, China and every other country in the world except for the rest of the U.S. and Russia.
SHALE CRESCENT USA NATURAL GAS LIQUIDS
In addition to natural gas, the Shale Crescent has become a significant source of natural gas liquids. The EIA projects Shale Crescent USA will be producing almost one-third of all the natural gas liquids (NGLs) in the entire United States by 2040.
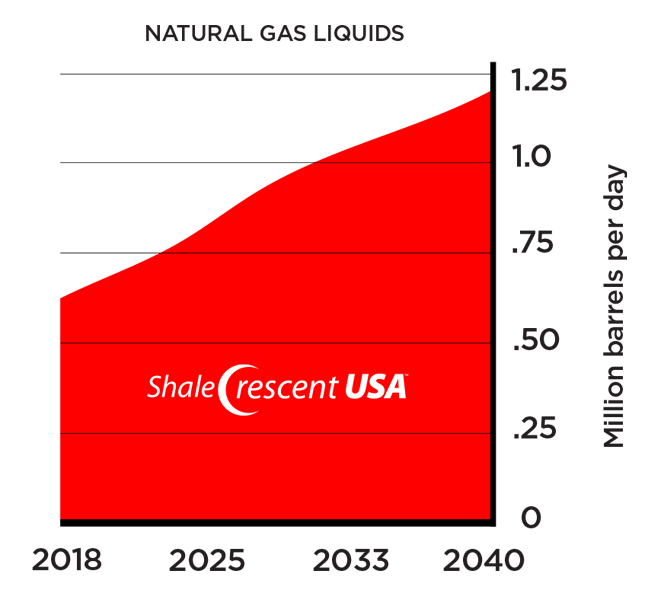
Natural Gas Liquids Production
Shale Crescent USA Natural Gas Liquids Statistics:
- NGL production will increase from 0.60 million barrels per day in 2018 to 1.17 million b/d in 2040*
- Is forecasted (by 2040) to produce as much NGLs as the entire U.S. produced in 2008
- Ethane production is forecasted to increase from 0.2 to over 0.7 million b/d, contributing about 25% of the total U.S. production by 2040*
- IHS Markit estimated that the Shale Crescent USA could support up to five Ethane Cracker Plants. Shell Chemical is now constructing the first in the region.
*Source: IHS Markit
SHALE CRESCENT NATURAL GAS SAVED U.S. END-USERS $1.1 TRILLION
$1.1 trillion dollars have been saved in the past ten years by end users of natural gas in the United States according to a recent paper by Kleinhenz and Associates: Natural Gas Savings to End Users: 2008-2018 A Technical Briefing Paper.

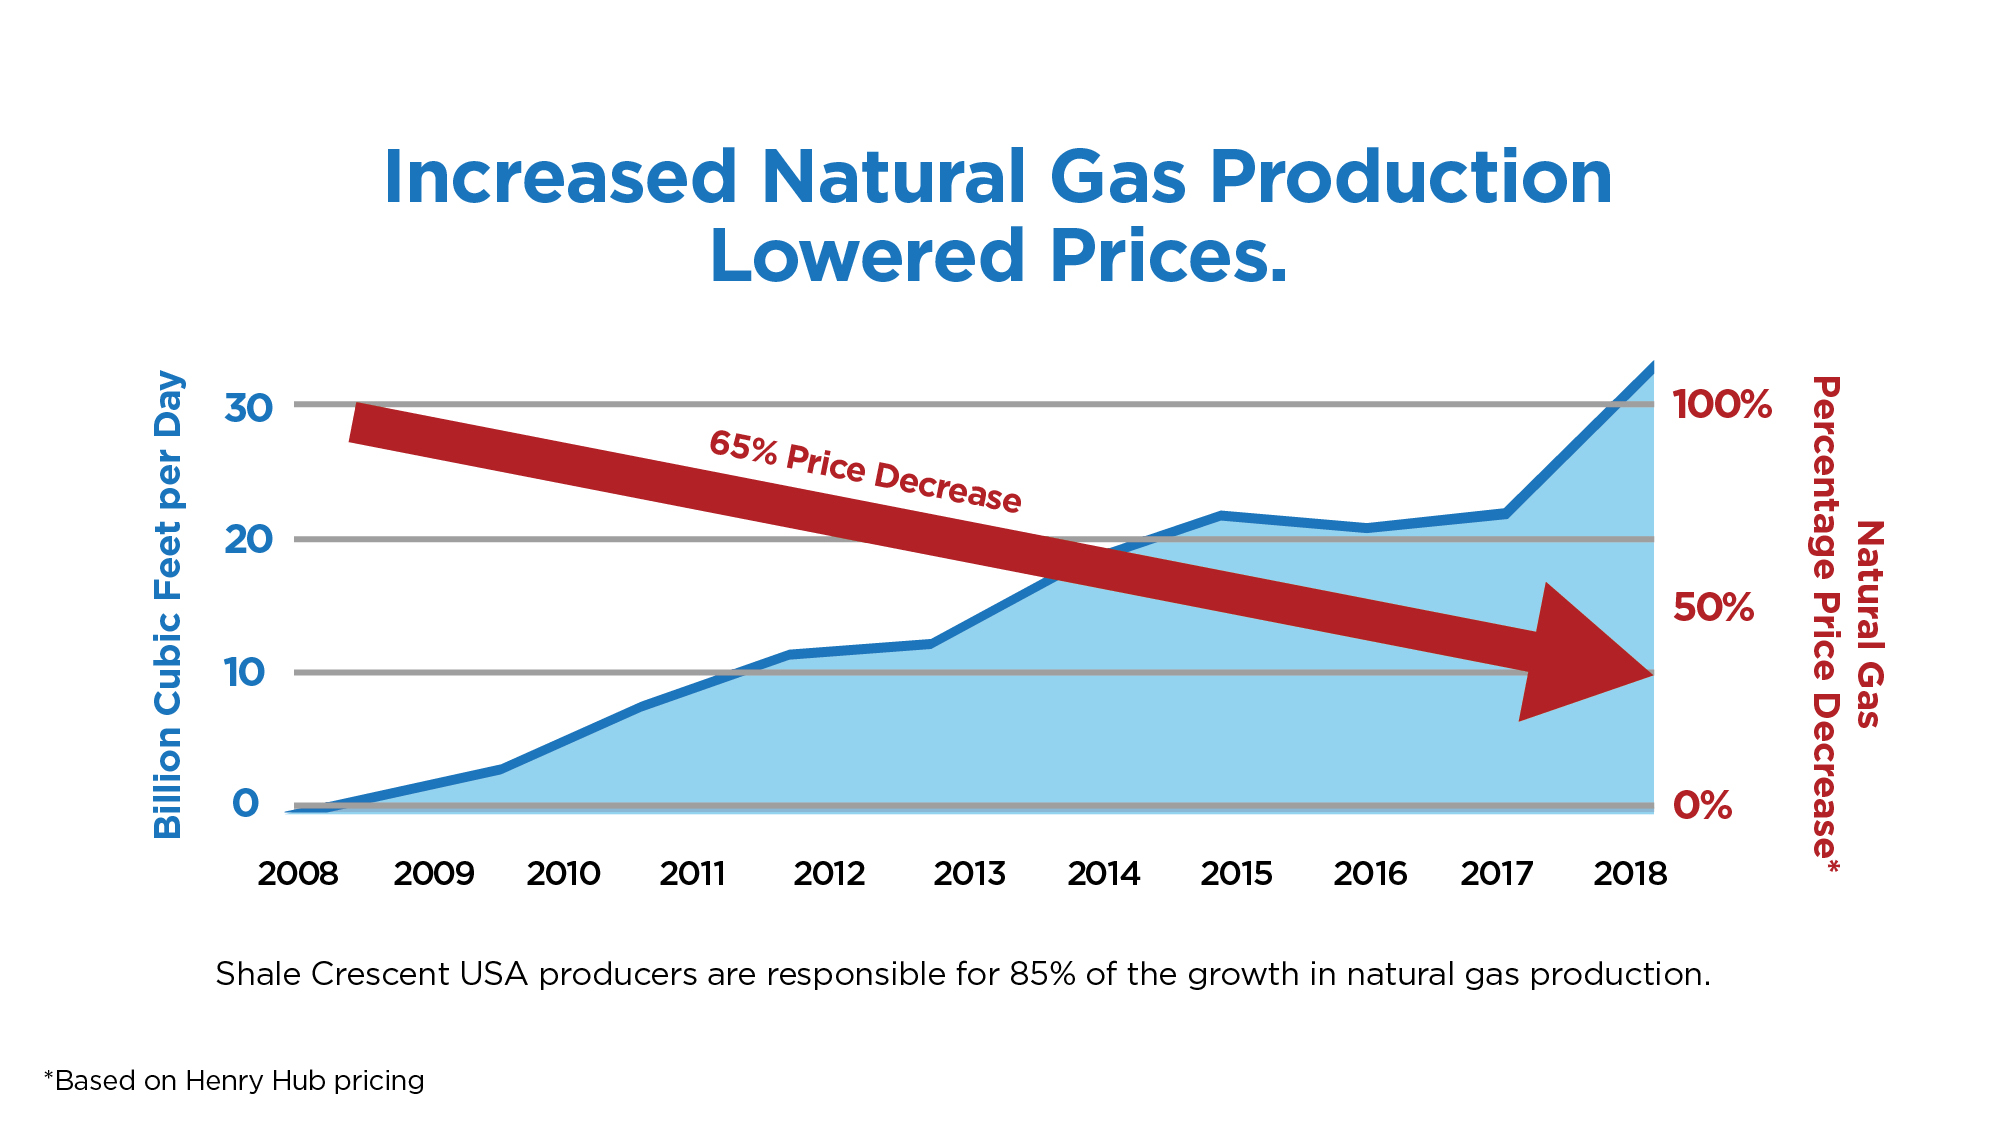
Increased Natural Gas Production led to lower prices. Virtually all of the new natural gas production (85%) has come from the Shale Crescent USA region.
The abundant new supply of natural gas has led to significantly lower natural gas prices.
The $1.1 Trillion in U.S. natural gas savings were spread out across residential, commercial, industrial, and electric power sectors.
Shale Crescent residential, commercial, electric, and industrial sectors have experienced $90 billion in savings over the past ten years. The industrial sector has saved $25 billion.